Phase
Diagram Module的更多信息请点击 Download
Phase Diagram Slide Show 下载(53页pdf格式介绍)
Phase
Diagram
模块是一个能够计算、画出和编辑单元、二元、三元或者多元相图的通用程序,相图坐标轴可以为
T, P, V, 组成, 活度, 化学势等各种组合。计算出的相图可以自动在 Figure 模块中作图。
可以计算与画出的相图种类包括:经典的单元系温度-压力、二元系温度-组成、三元系等温等压Gibbs三角相图、
多元系的二维截面,其中的坐标可以为T, P, V, 组成, 活度,
化学势等各种组合、优势区图,如Cu-Fe-Ni-S-O多元系中Pso2 对
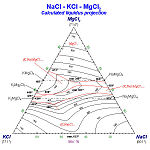
Po2作图,其中的各物相为真实溶液如冰铜、炉渣和合金等; 倒易熔盐相图等。
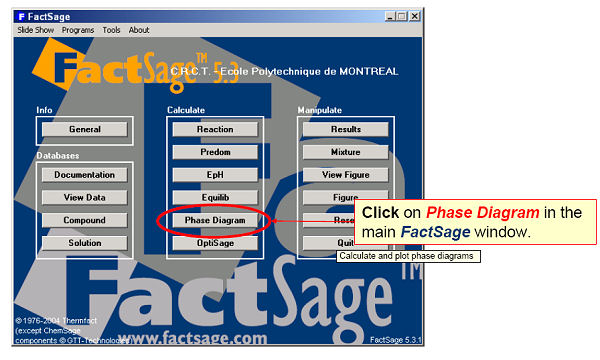
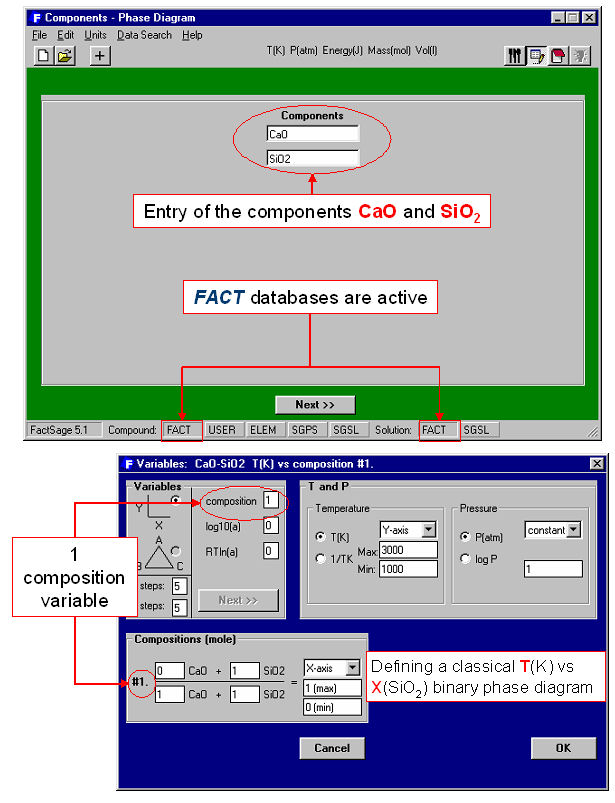
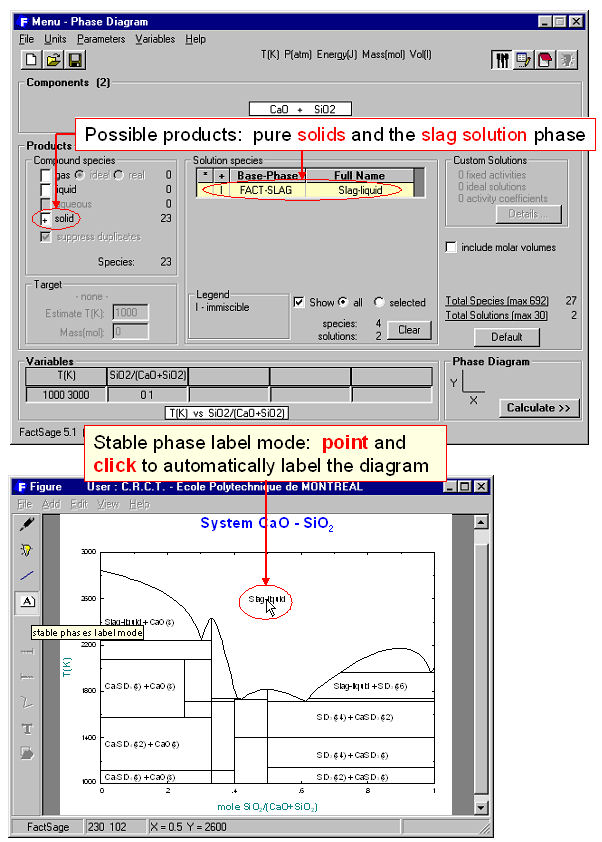
图2和图3表示 CaO-SiO2
二元系温度对组成的相图计算过程。在Phase
Diagram 模块中,首先在 ReactantsWindow
(图2上部)输入 中体系组元(CaO,
SiO2),然后在 Variables Window (图2下部)定义相图类型,其中用户选择
相图种类 (Y 对 X, 或 Gibbs三角), 坐标轴类型 ( 组成, 活度或者化学势),
可能的组成变量, 相图的范围及恒定量。在 Menu Window (图
3上部),从化合物和溶液数据库中检索出来的所有物相作为可能的产物相 。对CaO-SiO2二元系,炉渣溶液相 (FACT-SLAG) 和所有的纯固相 (包括不出现在 CaO-SiO2相图中的) 都选择作为可能的产物在计算中考虑。通过点击 ‘Calculate’ 按钮,相图可以被实时计算与显示出来(图3下方)。 计算完成后, Figure 模块中将相图作为一个动态界面,通过点击相图中的任意区域,可以自动标注结线与稳定相;也可以对相图进行后处理:增加标注线;计算并列出相图中任一点的平衡相组成及数量;编辑相图 (增加实验数据点,文字,改变颜色等)。
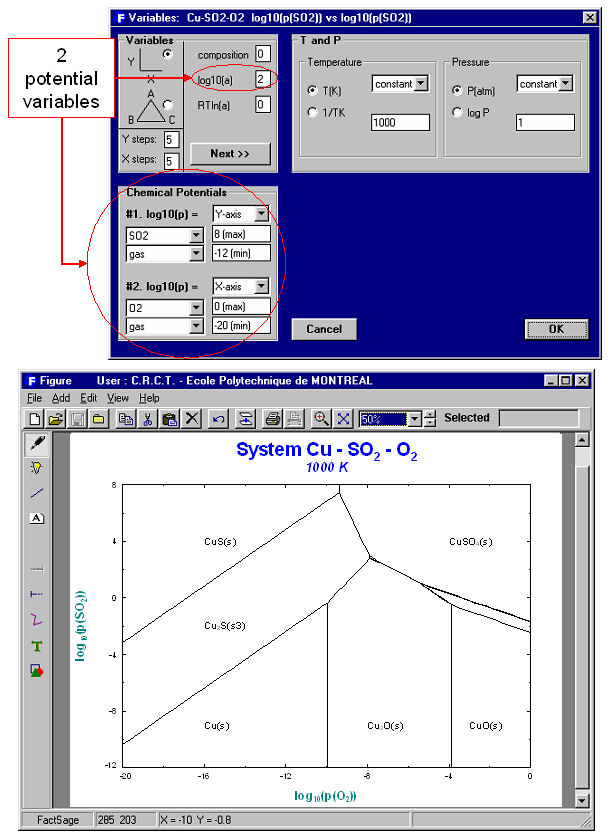
Variables
Window 中通过灵活选择多种坐标,可以做出不同的相图。图4是经典的Cu-SO2-O2 系等温优势区图。体系组元为 Cu, SO2, O2;坐标轴变量为 log10(Pso2)
和log?0(Po2) ,温度设定为恒定;相图中可能的物相为气相及固体计量化合物,其数据均来自FACT 化合物数据库。该图可以与 Predom 模块做出的相图可以互相比较。
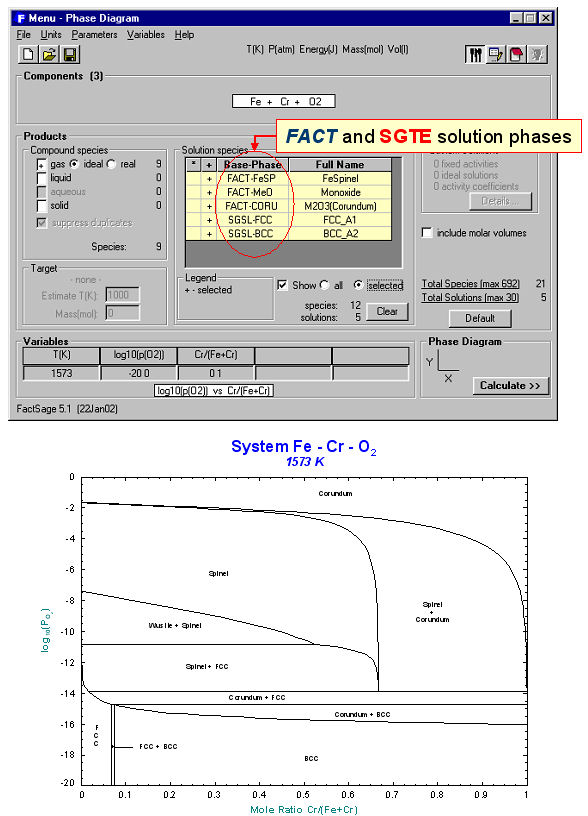
与Predom
模块不同,, Phase Diagram
做出的优势区图能同时包括了溶液数据库中的数据。 图5 表示1573K时Fe-Cr-O2系的 log10(Po2)
对 Cr/(Cr+Fe) 相图。可能的物相包括气相和各种真实溶液取自 FACT氧化物数据和SGTE合金数据库。图6为 FeO-TiO2-Fe 中T(C) 对 TiO2/(FeO+TiO2)
的 50 mol % Fe等浓度线的输入与输出,也使用了 FACT
和 SGTE
和溶液数据库。Phase Diagram
交互能力的一个例子是图7所示的平衡计算,用户选择相图编辑的phase equilibrium模式后,将鼠标指向并点击坐标为 1450ºC
和TiO2/(FeO+TiO2) = 0.7的点,就可算出该点的平衡物相的组成及数量,这些结果与利用Equilib 模块1450ºC 和 1 atm ,反应物为0.7 TiO2 + 0.3 FeO + excess Fe时计算出的结果相同。
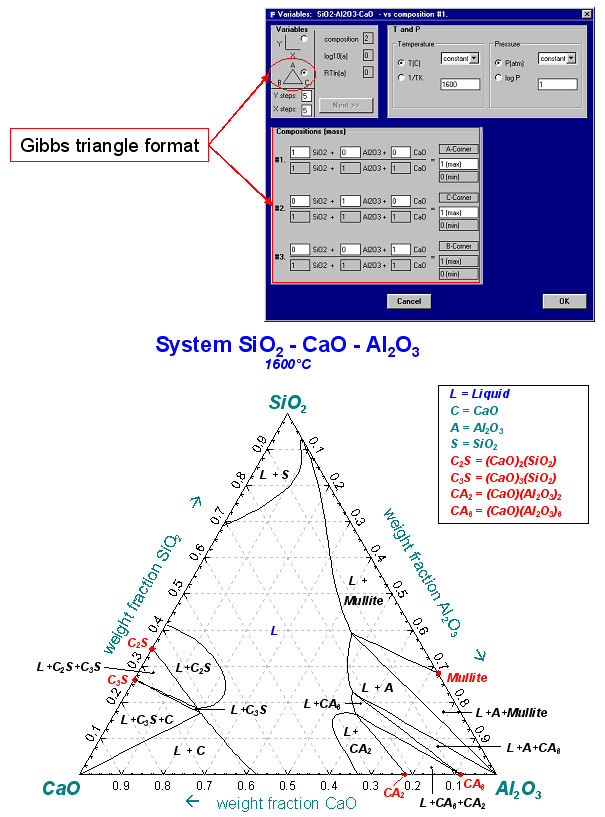
图8是使用 FACT数据计算CaO–Al2O3–SiO2 系的1600ºC等温截面的 Gibbs三角相图。
计算获得的相图可以存储为图形文件 (*.fig),通过Figure 模块进行编辑,输出为*.bmp, *.emf , *.wmf文件。图9-15演示了联合使用 Phase
Diagram, Equilib 和 Figure 模块做出相图的例子。
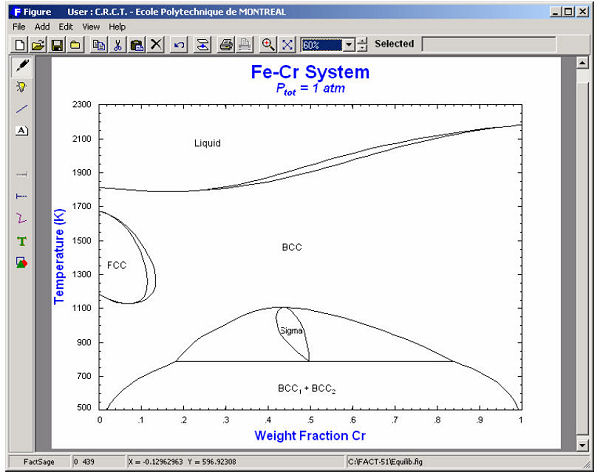
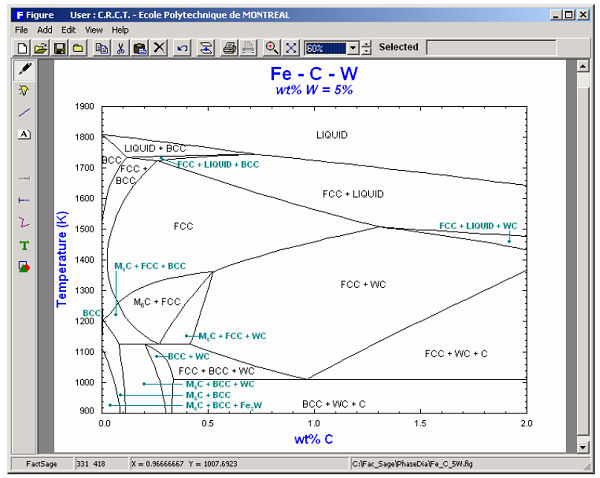
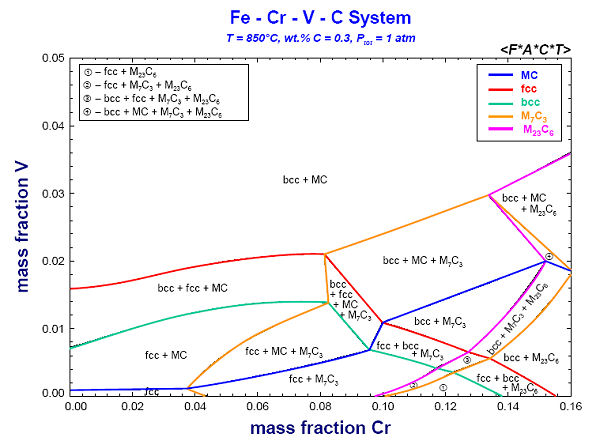
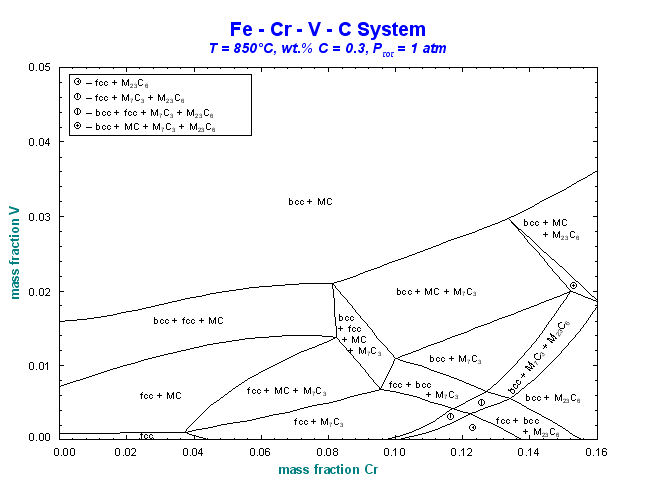
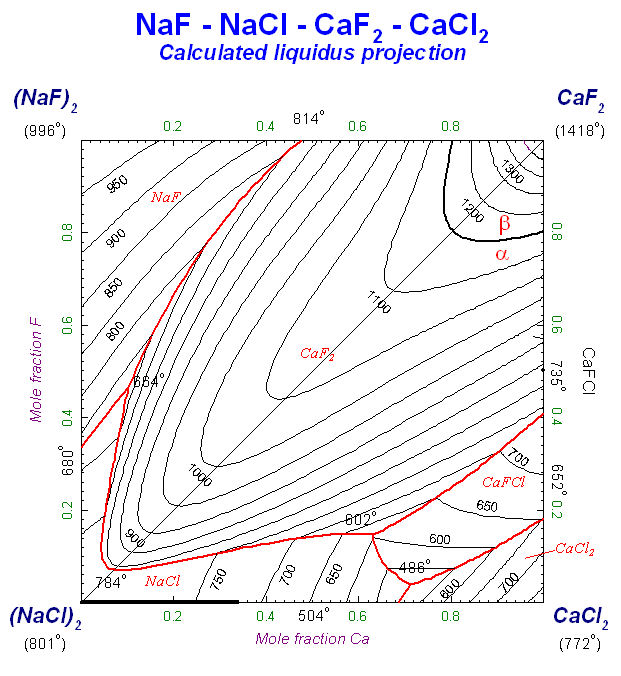
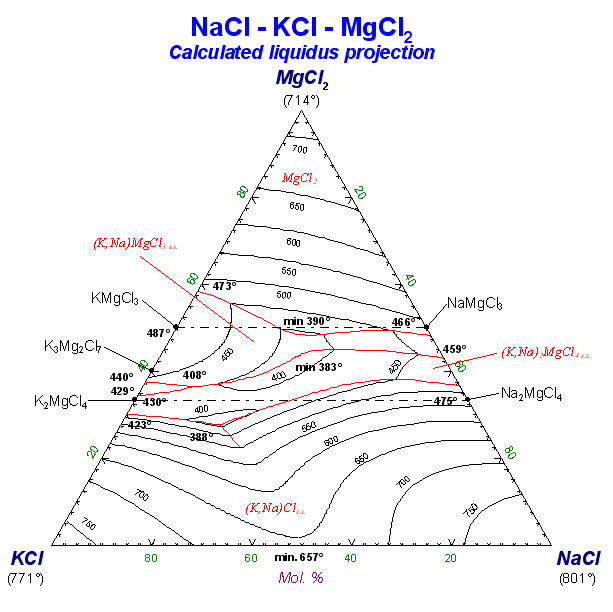
A
variety of calculated phase diagrams - some edited and
enhanced via the Figure
Module (labels added, etc.) – are shown in Figs
9 to 15.

;)
;)
;)
;)
;)
;)